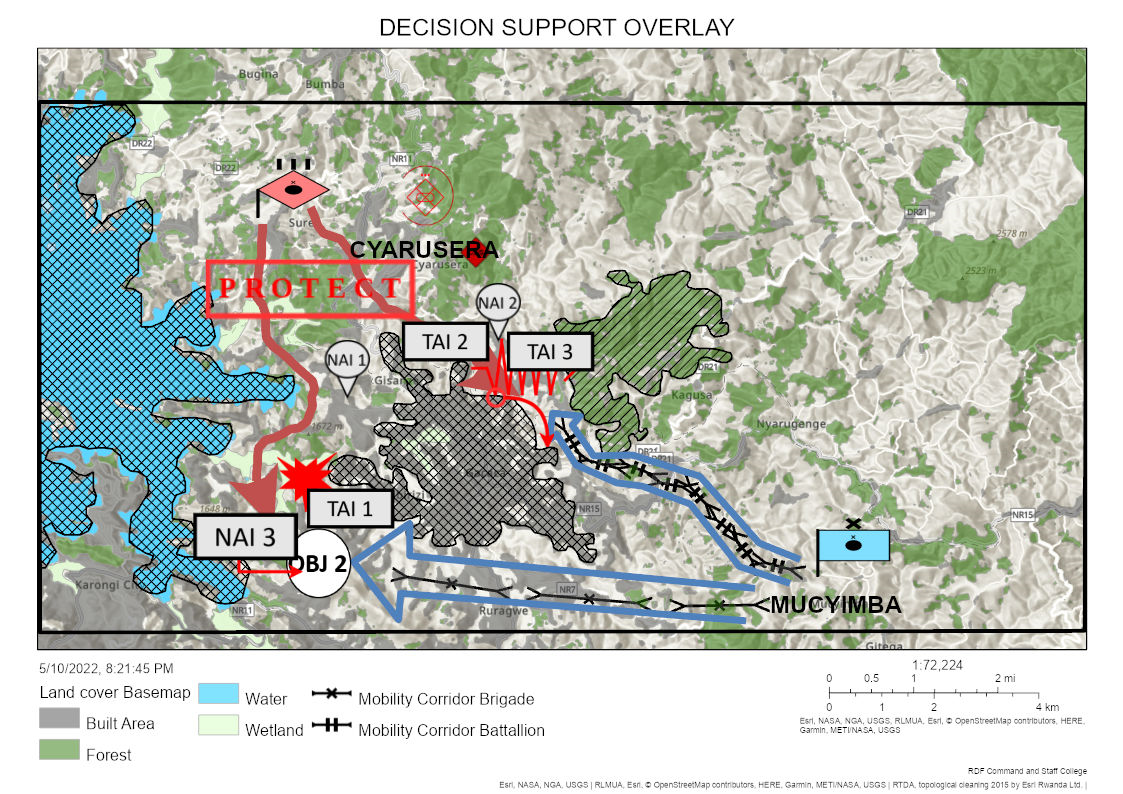
Sample Excercises:
Download the pdf version here
Terrain Analysis Overlay
Step 1: Activate the Grid
Using the tools found on the left side of the application, open the Grid widget. This widget will allow you to quickly render a Military Grid Reference System (MGRS) grid using client-side resources in a web app.
Click on Grid Widget.

The Grids pane and Grids system lines (vertical and horizontal lines) automatically appears in the map in different colors.

Turn on the Display grid when widget is closed. This will keep the grid system active, as you work with other tools in the application.
You can even change colors of different lines. To change the color code, click on the color code and change it based on your preference.
To close the Grid widget, click on the collapse buttons at the bottom.

Step 2: Draw the Area of Operation
Using the drawing widget found at the right top side of the application called Toolbox widget. The Toolbox widget allows you to draw simple graphics and text on the map. You can also use it to add line distance or polygon area to the feature as text. This widget provides basic sketching and markup functionality to a web app. It also displays some measurements (if configured to do so) for drawn features, such as length for lines and area and perimeter for polygons. When the widget initially opens, a window appears that contains the following draw tools:
Point
Line
Polyline
Freehand polyline
Arrow
Triangle
Rectangle
Circle
Ellipse
Polygon
Freehand polygon
Text

You are going to use the Polygon sketching tool to draw the area of operation. 1. Click on the Toolbox widget 2. Choose the polygon draw tool

Choose the polygon with a black border and an empty fill.

4. Name the area to be drawn as AoO Based the MGRS grid coordinates activated in the map, search for the following grid coordinates: 35MQT 60 80, 35MQT 80 80, 35MQT 80 70, and 35MQT 60 70. 5. Using the mouse cursor, zoom to the extent of the country. 6. Zoom into 35M zone of the country 7. Zoom inside 35MQT extent 8. Keep zooming in to
35MQT 60 80; 60 being the Easting and 80 being the Northing.
Using the same process, zoom to the following points and connect them to create the area of operation
35MQT 80 80
35MQT 80 70
35MQT 60 70

Step 3: Add Data into the Map
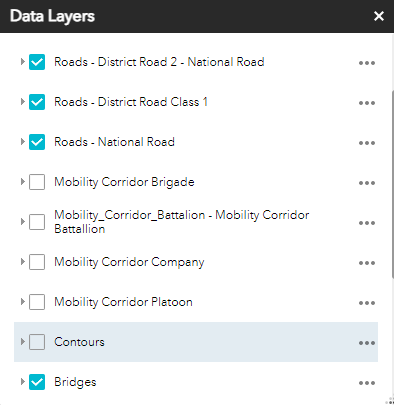
The Data Layers widget provides a list of operational layers and their symbols, and allows you to turn individual layers on and off. Each layer in the list has a check box that allows you to control its visibility. Some layers contain sublayers or subtypes. The order in which layers appear in this widget corresponds to the layer order in the map. This widget allows you to change the order of layers in the map.
Using the widgets found on the top right side of the application, open the Data Layers widget.
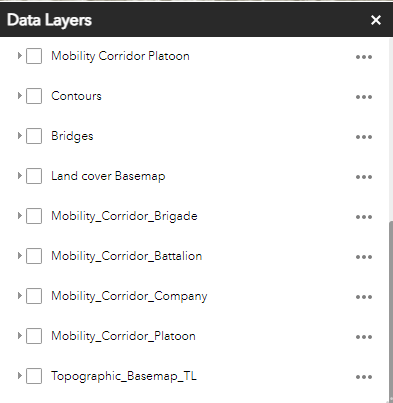
Activate the following the layers
Roads,
contours,
bridges,
Landcover basemap, and
the topographic basemaps

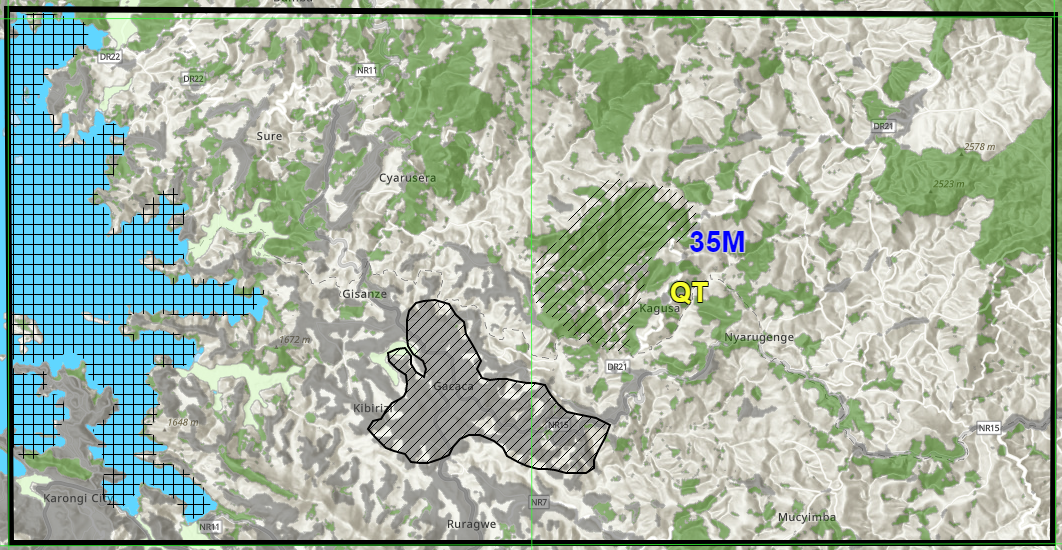
Step 4: Draw (Restricted and Very restricted data, strictly Restricted)
Using the Data Layers widget. Disactivate all the layers except the Landcover basemap.

Close the Data layers widget
Open the Toolbox widget.
Choose the freehand Polygon sketch tool

Name the restriction category to be drawn on the map.
Add as many drawings as you want based on your analysis.
Close the Toolbox Widget
Step 5: Add Place Names
Click on the Toolbox widget
Choose the Text sketch tool
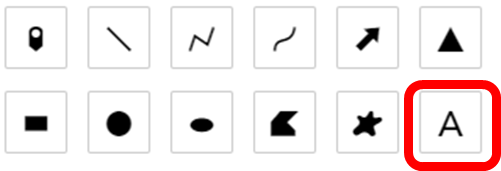
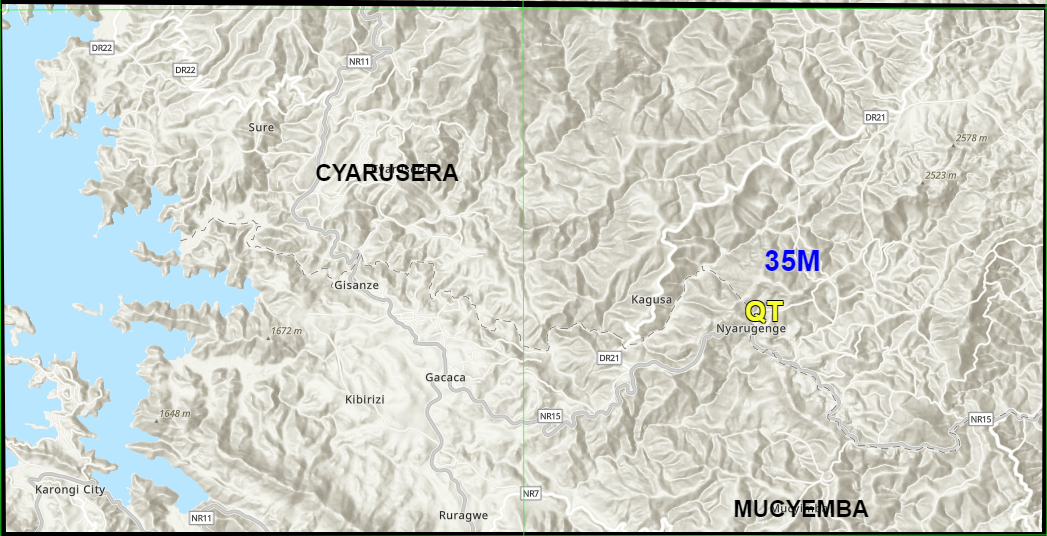
In the name space, type in a text CYARUSERA to be added on the map.
Change the size of the text to 23
Using the MGRS Grid system, add the text to 35MQT 674 769
Using the same process add RUCYEMBA to 35MQT 753 705
Close the Toolbox widget
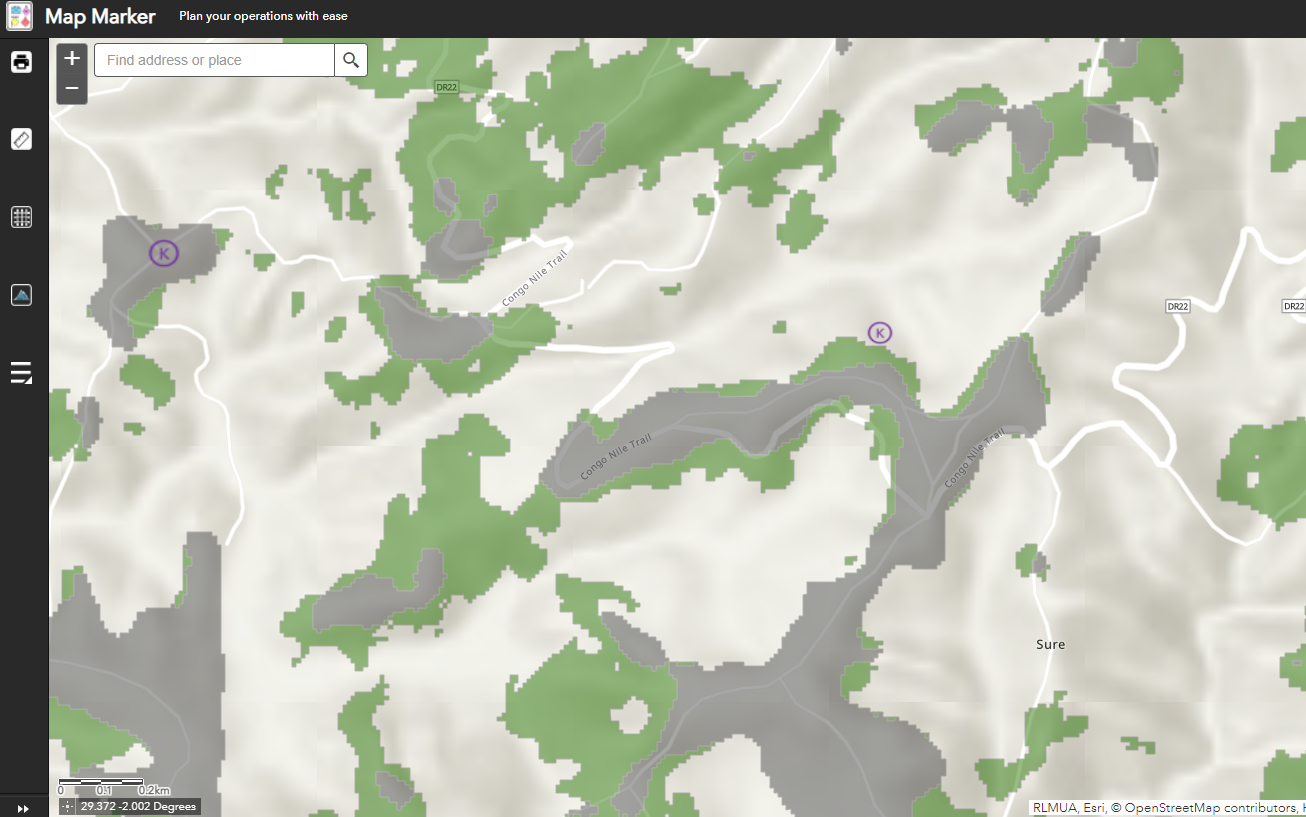
Step 6: Add Key Terrain
Using the Data Layers widget. Disactivate all the layers except bridges and roads data.
Close the Data layers widget
Open the Toolbox widget.
Choose the Point sketch tool
Name the drawings to Key Terrain
Choose Custom Image in the drawing type
Click Choose file, and upload a file from your computer representing the symbol of Key Terrain features
Add a key terrain to every necessary bridge and road intersection in the map.
Close the Toolbox Widget
Step 7: Add Military Symbols
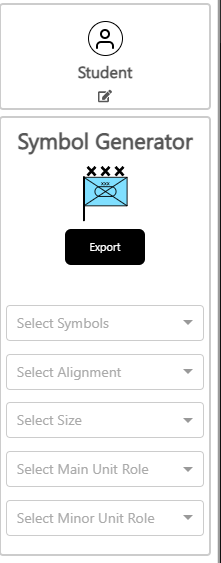
Using the Military Symbology Editor on the left, Create a Military Symbol of your choice
Export the generated file
Open the Toolbox widget
Choose the point sketch tool
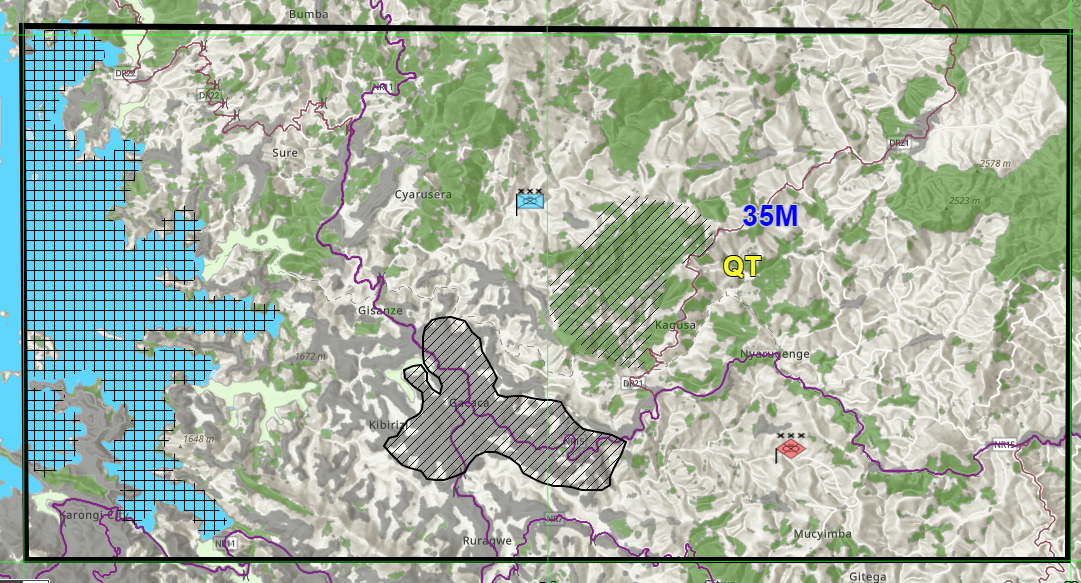
Name the drawings based on the generated Mil symbol
Choose Custom Image in the drawing type
Import the file generated from your location machine
Add the imported Military Symbol file to the map
Step 8: Add Objective
Open the Toolbox widget.
Choose the Point sketch tool
Name the drawings to Objective
Choose Custom Image in the drawing type
Click Choose file, and upload a file from your computer representing the symbol of objective features
Add objective in the map.
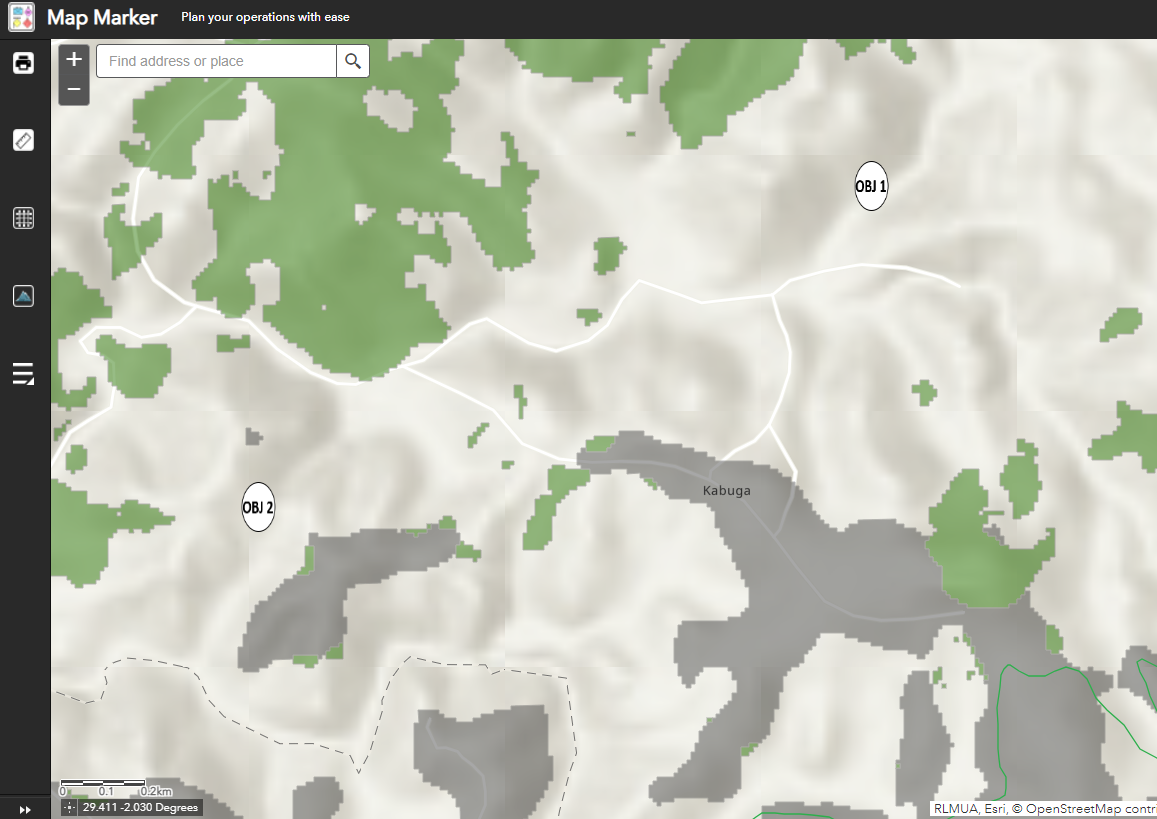
Close the Toolbox Widget
Step 9: Create Mobility Corridors
Using More Option widget on the left, click on the Smart Editor widget.
Choose the Mobility Corridors of your choice
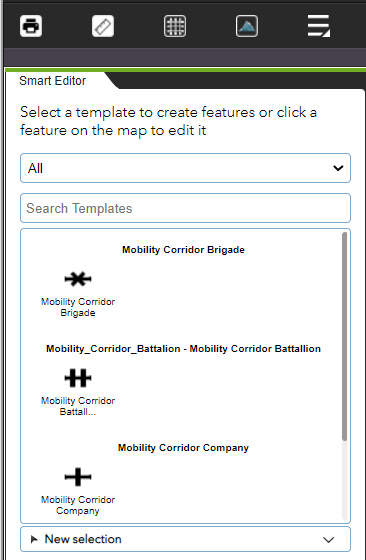
Draw the line on the map and click save in the Smart Editor
Draw more lines using different categories (Brigade, Battalion, Company, and Platoon) to create the mobility corridors
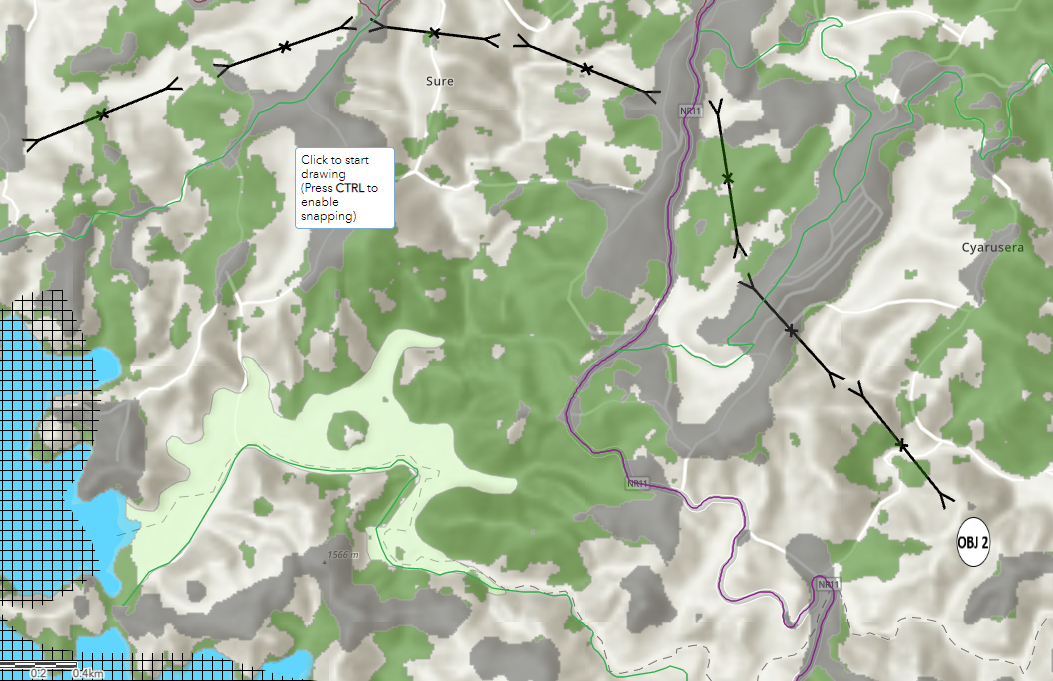
Close the Smart Editor Widget.
Step 10: Add Avenues of Approach and Enemy Routes
Open the Toolbox widget.
Choose the Line sketch tool
Name the drawings to Avenues of Approach and add its description
Choose a blue color to draw the AAs
Draw the AAs in the Map
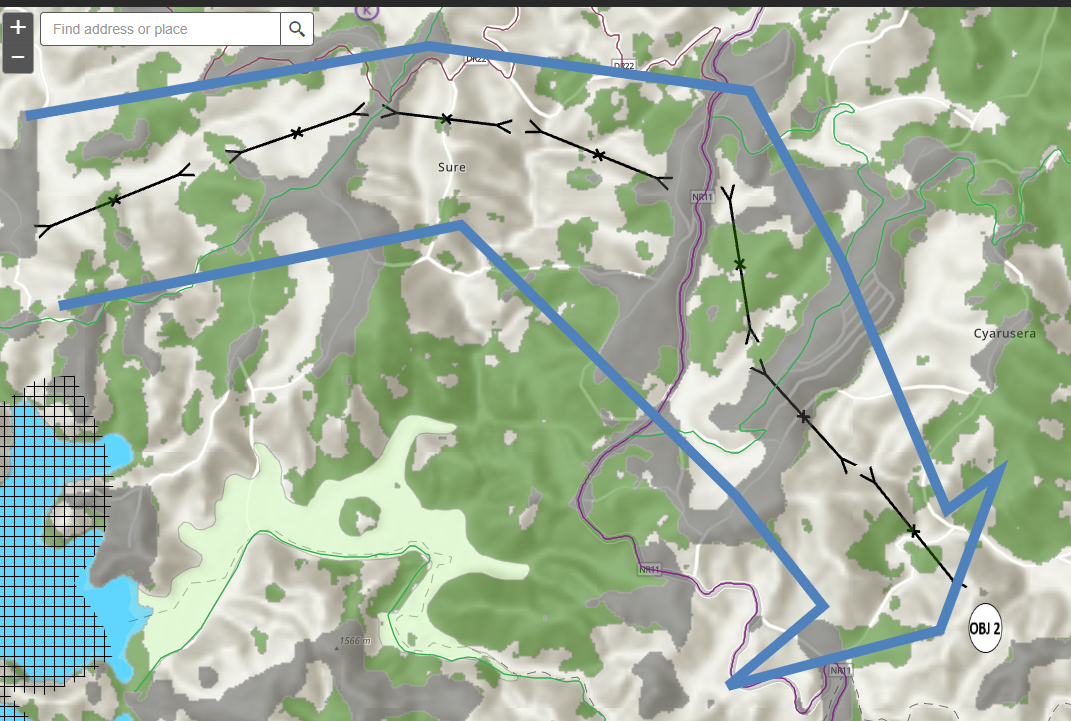
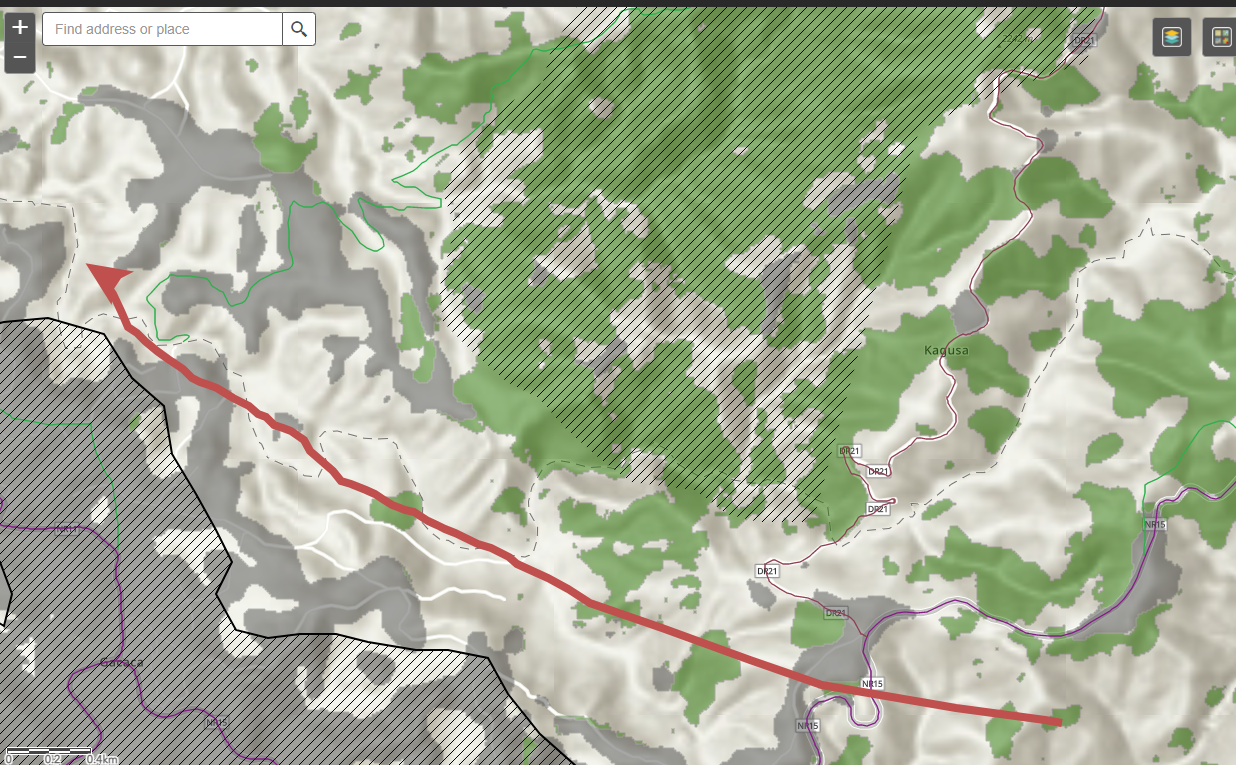
To draw the enemy routes, choose the freehand polyline sketching tool
Name the enemy route and add its description
Choose a red color to represent the Enemy Route
Enable the arrow to be drawn at its end
Draw the Enemy Route in the Map
Close the Toolbox Widget
Step 11: Demonstrate the Elevation Profile
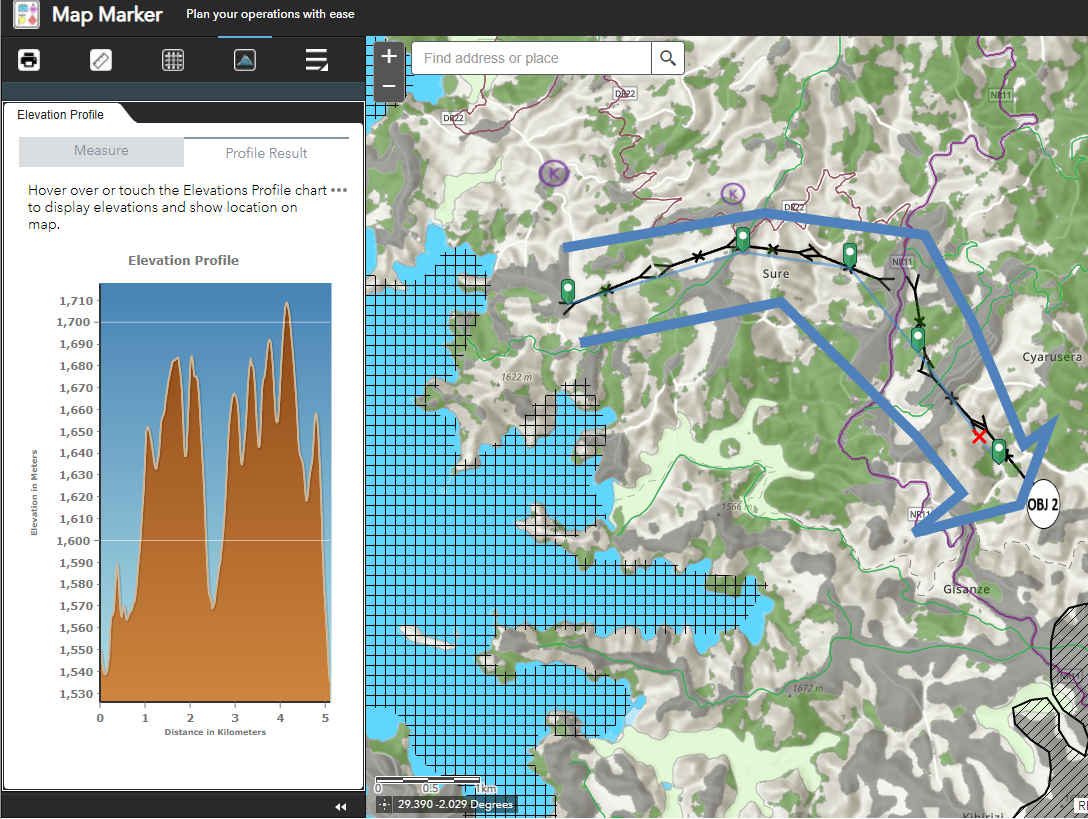
This widget allows you to measure a line on the map and get the elevation profile for that line based on the profile geoprocessing service supplied. You can also select an existing line feature and in those lines popup menu you can choose “Profile selected line…” 1. On the left of the map, turn on the Elevation Profile widget. 2. Click on the Distance button to measure the distance and defining its profile

In the map, draw the line inside the AAs to see its profile.
Close the Elevation Profile Widget
After understanding the elevation profile of your avenue of approach. You can choose to direct your forces in different direction.
Step 12: Print out the Map
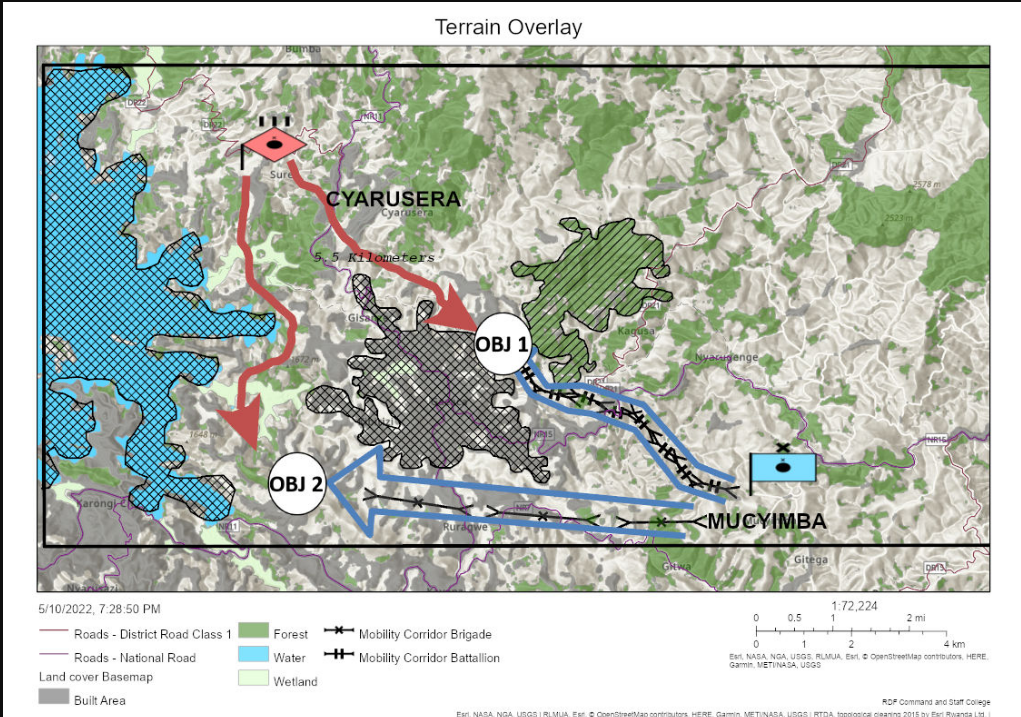
The Print widget connects the web app with a printing service to allow the current map to print. 1. Open the Print widget found at the left top of the map 2. Insert the title as Doctrine Overlay 3. Download the Printed Map
Threat Evaluation
Step 1: Doctrine Overlay
In the Data Layers widget, uncheck all the layers
Open the Toolbox widget.
Choose the Point sketch tool
Name the drawings to Screen
Choose Custom Image in the drawing type
Click Choose file, and upload a file from your computer representing the symbol of a screen
Increase the size of the screen to 50
Add the screen symbol in the map
Repeat the same process to add other symbols
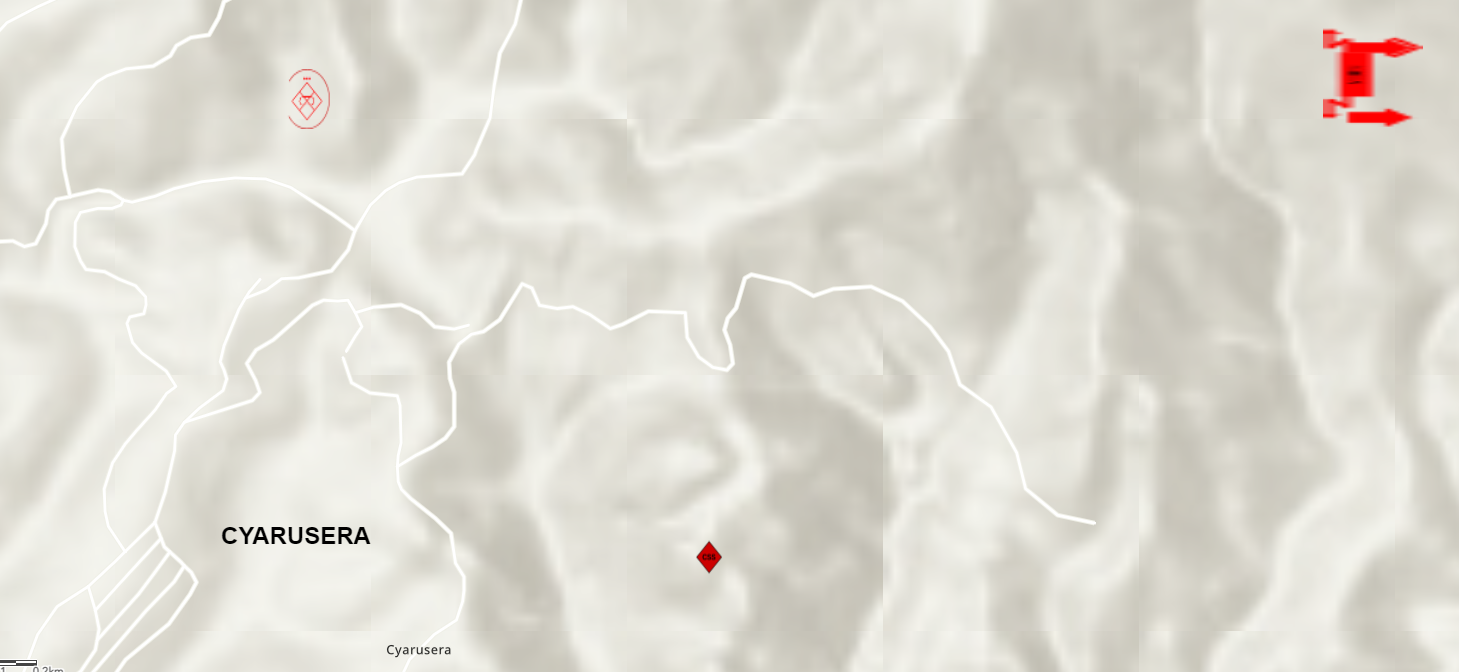
Using the elevation profile widget, you can measure the distance between symbols, and determine the frontage and width of the Doctrine 10. Close the Toolbox Widget 11. In the Data Layers widget, Check all layers.
Step 2: Print out the Map
The Print widget connects the web app with a printing service to allow the current map to print. 1. Open the Print widget found at the left top of the map 2. Insert the title as Doctrine Overlay 3. Download the Printed Map
Threat Integration
Step 1: Situation Overlay (COA 1)
Open the Toolbox widget.
Choose the Point sketch tool
Name the drawings to Protect
Choose Custom Image in the drawing type
Click Choose file, and upload a file from your computer representing the symbol of protect
Increase the size of the screen to 50
Add the Protect symbol in the map
Repeat the same process to add other symbols used in Situation Overlay
Close the Toolbox widget
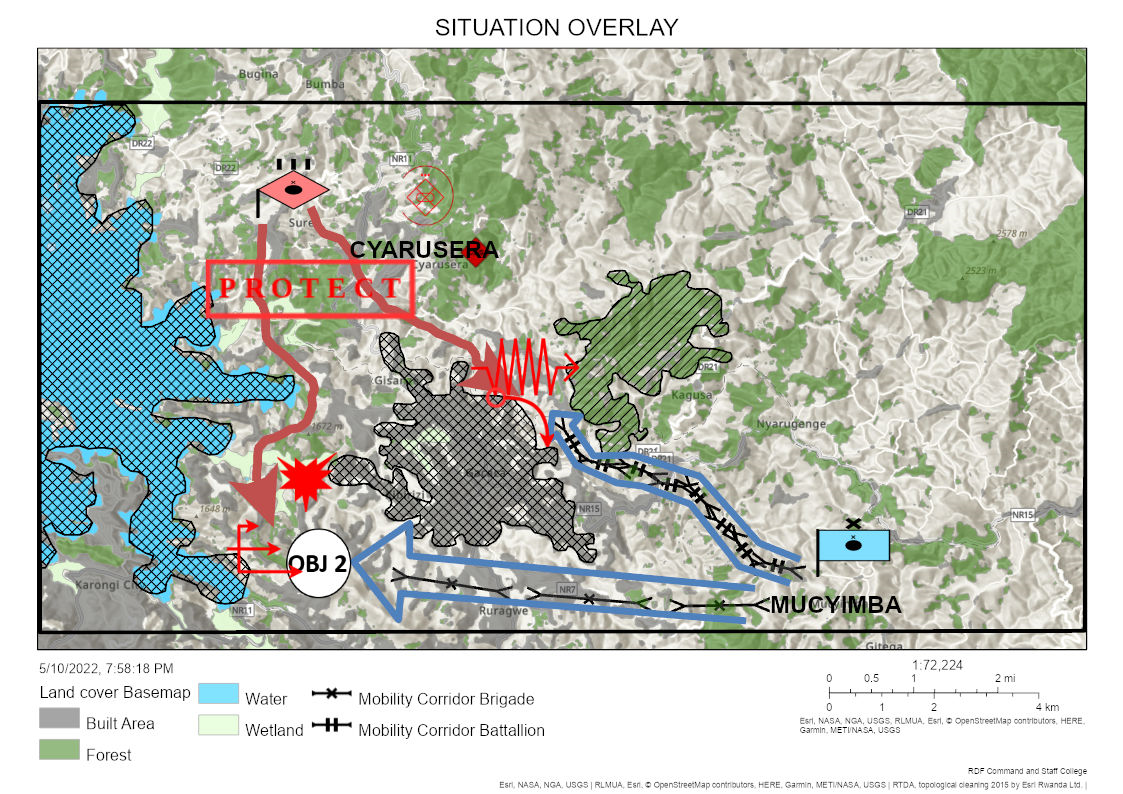
Step 2: Add Phase lines in the Map
To create phase lines there is a need of a deep analysis, that involves movement and distance analysis. It is recommended to first use the elevation profile widget to get an understanding of how places differ in elevation and slope. From there, you can use the guide below to draw phase lines. 1. Open the Toolbox widget. 2. Choose the Line sketch tool 3. Name the drawing to Phase Lines 4. Add Phase lines based on the terrain 5. Close the Toolbox widget
Step 3: Print out the Map
The Print widget connects the web app with a printing service to allow the current map to print. 1. Open the Print widget found at the left top of the map 2. Insert the title as Situation Overlay COA 1 3. Download the Printed Map
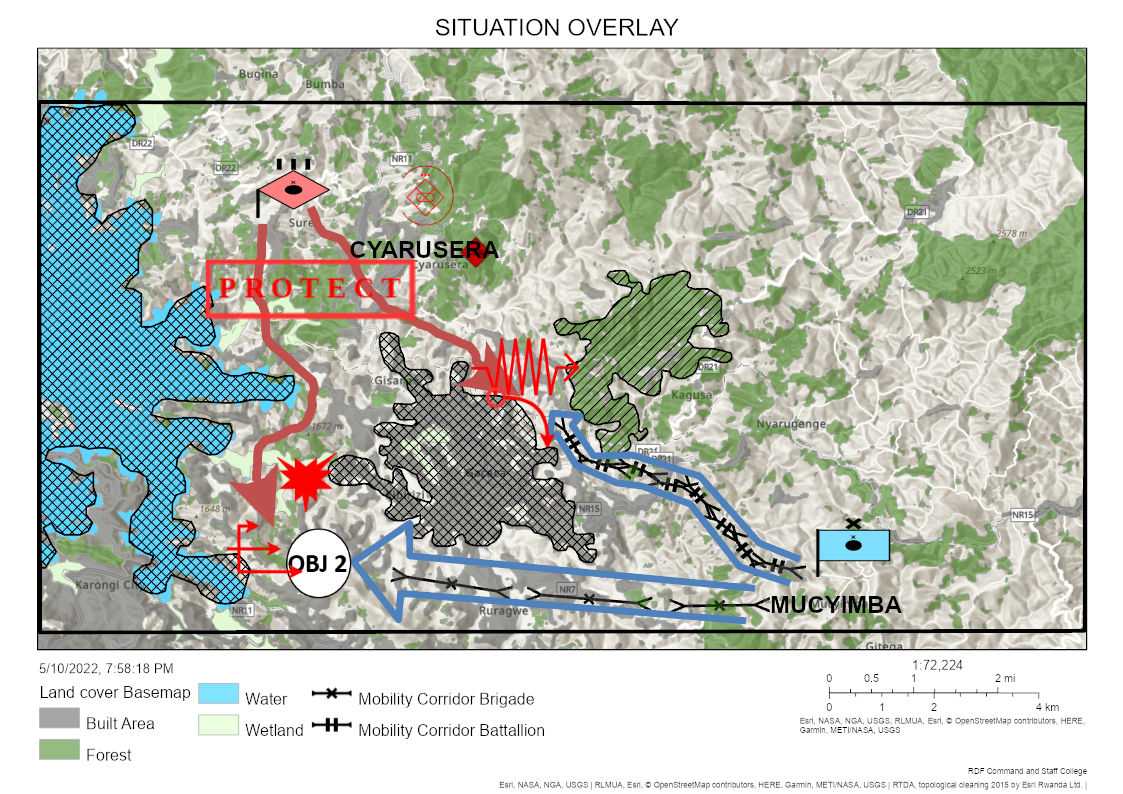
Step 4: Event Overlay
Open the Toolbox widget.
Choose the Point sketch tool
Name the drawings to NAI 1
Choose Custom Image in the drawing type
Click Choose file, and upload a file from your computer representing the symbol of Point NAI 1
Increase the size of the NAI 1 to 50
Add the NAI 1 symbol in the map
Repeat the same process to add other symbols used in Situation Overlay
Close the Toolbox widget.
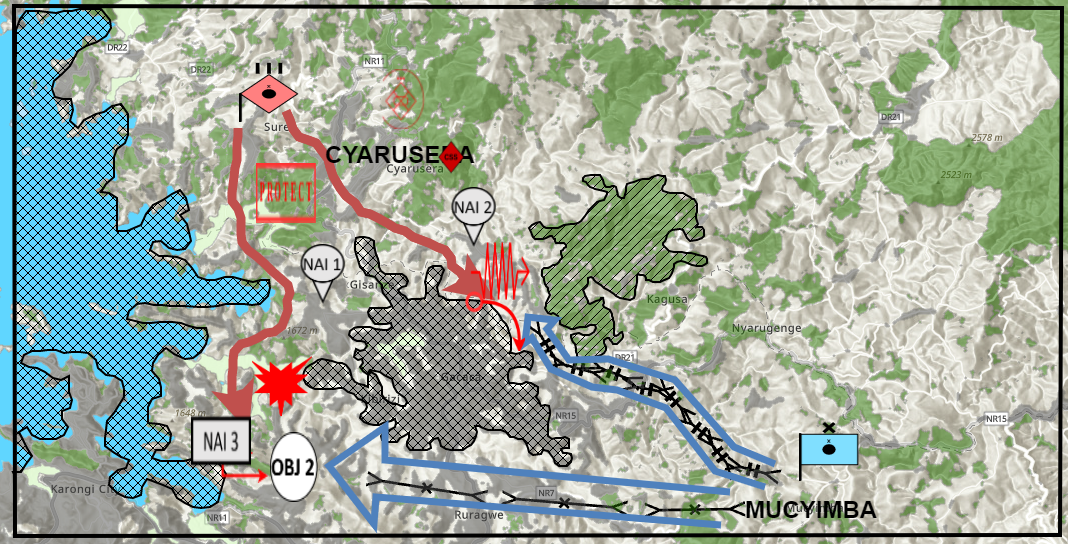
Step 5: Print out the Map
The Print widget connects the web app with a printing service to allow the current map to print. 1. Open the Print widget found at the left top of the map 2. Insert the title as Event Overlay 3. Download the Printed Map
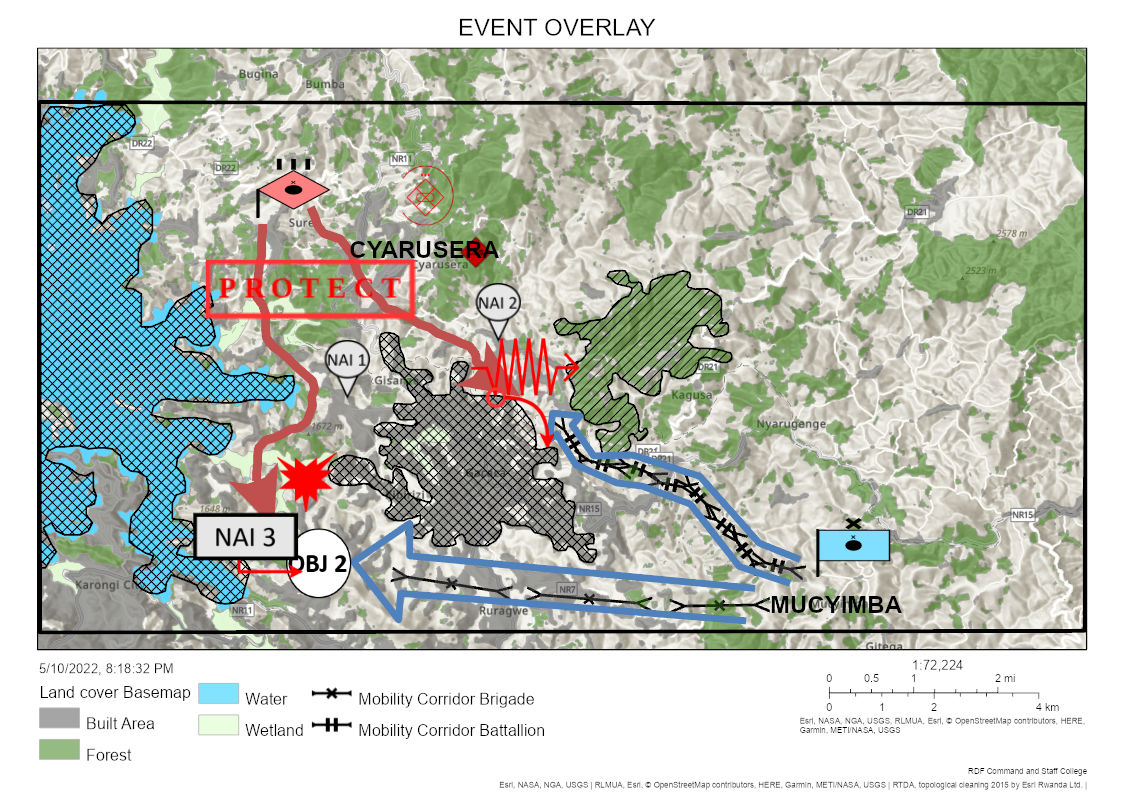
Draft Decision Support Overlay
Step 1: Do the following activities:
Open the Toolbox widget.
Choose the Point sketch tool
Name the drawings to TAI 1
Choose Custom Image in the drawing type
Click Choose file, and upload a file from your computer representing the symbol of Point TAI 1
Increase the size of the TAI 1 to 50
Add the TAI 1 symbol in the map
Repeat the same process to add other symbols used in Decision Support
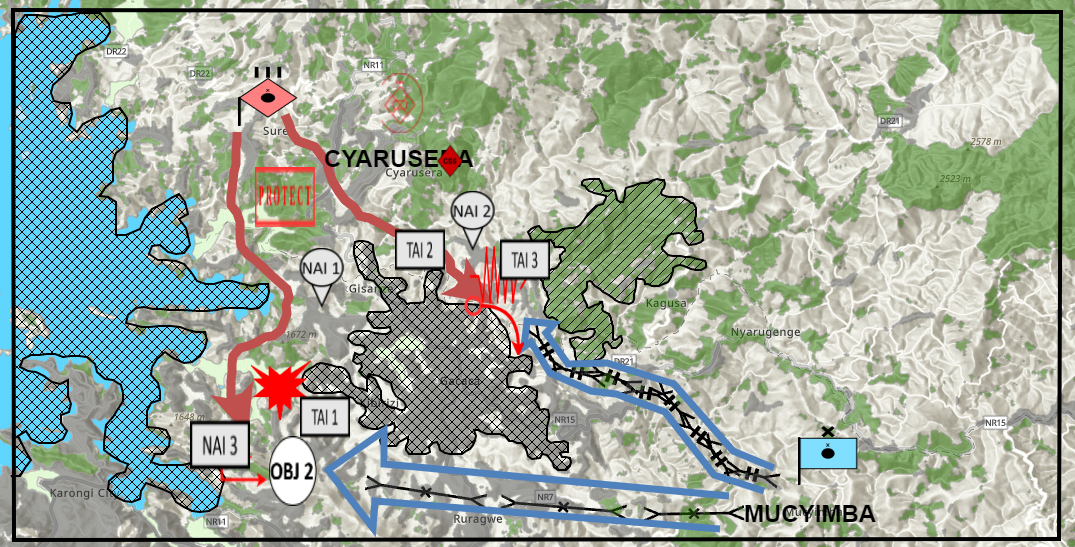
Close the Toolbox widget
Step 1: Print out the Map
The Print widget connects the web app with a printing service to allow the current map to print. 4. Open the Print widget found at the left top of the map 5. Insert the title as Decision Support 6. Download the Printed Map
